Easy Way to Track Your Site Traffic: Wix Analytics
It is very frustrating to work long hours for weeks and months without seeing any result.
I had that feeling when I worked on my first site a couple years ago. Even though I strongly believed the result would come, I did feel that frustration every day. Until my partner showed me the analytic numbers.
Those numbers show me my progress. And they will show your progress. You just have to find them, read them, and take the actions to improve your site.
1. How to check Wix Analytics?
Before you can see your site traffic numbers, you must be able to open Wix Analytics. But the tool is hidden in the dashboard area. It takes a little research to see where it is. I did the research. You just follow the instruction below to check your Wix analytics.
Steps to display Wix Analytics
- 1. Click “Settings” Menu
- 2. Click “My Dashboard” option
- 3. Click “Analytics”
2. What do the numbers mean?
If this is your very first time running a website, the numbers on Wix analytics seem to be overwhelming. You don’t know what they mean. I used to be in that situation. I know the feeling. The good news is, it will get better.
In case you don’t understand the numbers, you should read the explanation below. It teaches you to look at the numbers like a doctor looks at the symptoms. Then, you know the next steps to make your site better.
2.1. Select date range
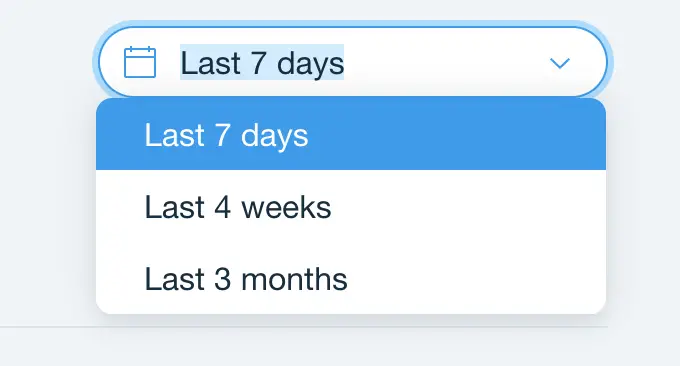
The first step is to select a time period in which your traffic progresses. You have three options: Last 7 days, Last 4 weeks, and Last 3 months. So which option is the best?
It depends on many factors. I know you hate this answer. But bare with me. The major factor is your traffic source. If you get your visitors from paid ads, then your traffic is changing fast. You burn your money fast as well. That is why you want to see your result quickly. So you can stop your lost if you get bad results. In this case, the Last 7 days option is your go-to.
On the other hand, seven day period isn’t long enough to monitor slowly change traffic like SEO. In this case, Last 4 weeks or Last 3 months options give you a better picture.

2.2. Traffic Analytic Numbers
Down below the date range, you see the numbers for Visits, Unique Visitors, Bounce Rate, and Forms Submitted. I list their definitions below. They are from Wix.
- Visits: The number of visits to your site in the last 7 days, including multiple visits by the same visitor.
- Unique Visitors: The number of people who visited your site in the last 7 days.
- Bounce Rate: The percentage of people that visited your site and left after viewing only one page.
- Forms Submitted: The number of contact forms submitted by visitors.
Often you see the Bounce Rate above 80%. This high number worries many people. But it is not bad at all. People search for something online. They come to your site and find the answer. Then they leave. It’s normal human behavior. Nothing wrong.
You should pay close attention to the numbers of Visits and Unique Visitors. Your primary aim is to get the number of Visits as high as possible. If you think it’s too small, then maybe create more blog posts, post more on social media, etc.
However, if the number of unique visitors is much smaller than the number of visits, then your site is very good at keeping the same visitors coming back. Your next step is to sell something to your fans. Or you will focus on getting new visitors.
2.3. Traffic Chart By Source
Further down the page, you will see the chart that breaks down your traffic by source.
- Social: Visits from people on social media (like Facebook, Instagram)
- Direct: Visits from people who enter your site URL directly into their browsers
- Referral: Visits from people on none social media sites (like blogs)
- Search: Visits from people on search engines (like Google, Yahoo, Bing)
If you are working on a particular traffic source, the result of your work will show up here. If your site has been around for a while, you can tell which traffic source work best. Then you invest more time, money, and effort on it.
2.4. Traffic Chart By Device
Right next to “By Source” tab is the “By Device” tab. Click on it to see the chart that breaks down your traffic by device.
- Desktop: Visits from desktop or laptop computers
- Mobile: Visits from smart phones
- Tablet: Visits from tablets
A huge portion in Mobile will tell you that your visitors like to use smart phones to view your site. Then you make sure every page of your site appears nice and clean on mobile view in Wix Editor.
And don’t forget to break long paragraphs into smaller ones. Each has about three or four sentences. So that they don’t look like a lengthy college essay on smaller phone screens.
3. What are alternatives to Wix Analytics?
The numbers provided by Wix Analytics are barely enough to track the traffic. That’s what I like about the tool. It doesn’t distract you with millions of numbers and charts like other tools.
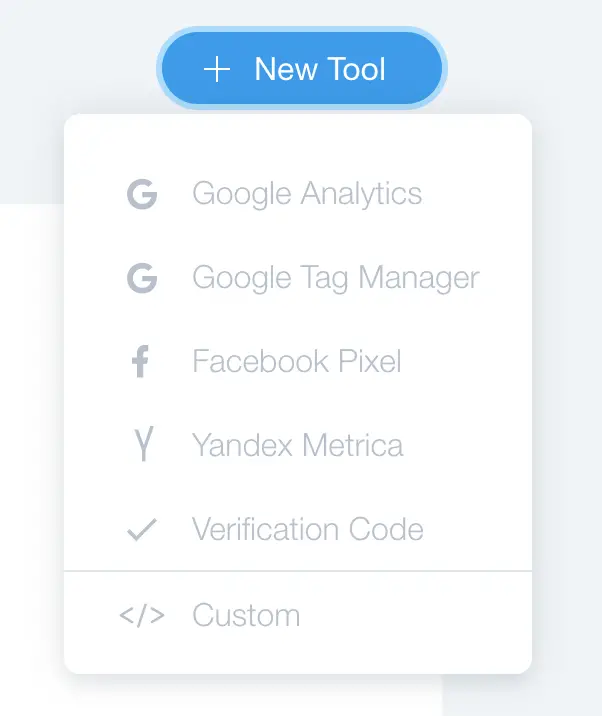
But Wix Analytics won’t be enough in the long term. As your business grows, you will need more than just a few numbers to track it. In other words, you need better analytics tools. Your alternatives are below:
- Google Analytics
- Google Tag Manager
- Facebook Pixel
- Yandex Metrica
- Verification Code
- Custom

I personally like Google Analytics the best. And In order to use those tools, you need a paid subscription with Wix.
Conclusion
Wix Analytics is a convenient way to track your site traffic. No need to register for an additional account. No worry about the coding. The tool exists and tracks your traffic from the moment your site is born.
However, Wix Analytics doesn’t provide enough traffic information. This isn’t an issue when your site is young. But I still suggest you set up Google Analytics ASAP. Google will send you traffic. So who else knows your traffic better than Google?